Construction · Digitalisation · v1.2
The construction industry's
shared language
and digital foundation
In construction today, everyone names the same thing differently: the designer, the contractor and the investor speak three languages, and data gets lost along the way. STRATERA puts this right. It gives a shared language and five connected tools, so that whatever someone enters once is present everywhere — from design to operation — and everyone receives it in the form they can work with: the investor sees a price, the contractor sees materials, the authority sees a finished report.
Insight · Output examples
One project, five outputs
Let's take an example: a school renovation runs through all five modules. The data is entered once — the designer names the elements in the model — and everyone else receives their own ready-made: the investor the prices, the contractor the materials, the operator the reports. The insights below show this step by step.
⚠ Illustrative example: the project, figures and product data below are fictional sample data — they demonstrate the modules' actual output formats, not a real investment.
Project (sample)
KL-XIV-2026-003
Building type
EP-KOZ-OKT · Educational building
01 · Base
STRATICAElement register
STRATICA is the classification: it provides the shared language for the whole platform. Every building element, system, product, workflow, room and document gets a clear code — 1,330 codes across six tables, with Uniclass mapping. In this example the model's 47 element groups were coded; the element register is available in XLS, via JSON API and as an IFC attribute.
| STRATICA code | Description | IFC type | Quantity | Version |
|---|
| REN-SZE-FAL | Load-bearing walls | IfcWall | 1,840 m² | v1.0 |
| REN-HOT-HOE | Facade thermal insulation system | IfcCovering | 1,420 m² | v1.0 |
| REN-HOT-NYI | Thermal-bridge-free timber window | IfcWindow | 420 pcs | v1.0 |
| REN-GEP-FUT | Heating system | IfcDistributionSystem | 2,840 m² | v1.0 |
47 coded element groups · 100%
4 main tables · EP · REN · TER · MUN
Uniclass ref.
↓ XLS · JSON · IFC · CSV
02 · Data
COSTRATAItem structure
The construction industry's unified item structure. It organises budgets and bids into a common structure, making them directly comparable. The benchmarks and price levels built on it reveal the items that deviate from the market average.
P10 · Optimistic
1.19
bn HUF · 420,000 HUF/m²
P50 · Median
1.59
bn HUF · 560,000 HUF/m²
P90 · Premium
2.13
bn HUF · 750,000 HUF/m²
ANOMALY
The bid is 2.38 bn HUF — +11.7% above P90. 2 items flagged: interior door +95%, timber window +53% above benchmark.
Regional multipliers
Item-level P50 comparison
↓ Excel · PDF report
03 · Code
STRACODEProduct search
STRACODE is the library of construction products: more than 70,000 real, market-available products — with manufacturer, technical parameters, CE certificate and carbon data (for 1,535 products already from real manufacturer EPDs). Filtered here to the REN-HOT-HOE code, 4 matching products appear, with an automatic substitution suggestion.
★ RECOMMENDED
EPS
XYZ
Thermal conductivity λ0.033 W/mK
Fire classEuroclass E · EN 13501-1 ✓
CE conformityEN 13163 ✓
EPD numberEPD verified ✓
CO₂ footprint38 kg CO₂eq/m³
Net unit price~52,000 HUF/m³
4 matching products
CO₂ comparison
Substitution suggestion
04 · BIM
STRABIMData links & energy
STRABIM links the BIM model with the building's entire data asset: classification, product, cost, carbon and energy data can be mapped to every element. U-values derive from the layer build-ups, surfaces and volumes from the geometry — so the model yields not only a quotation but an energy calculation, and the same model serves as the reference for STRAVISION's stock analysis.
Critical
107 elements without a STRACODE link — 84 windows and 23 doors. A full carbon calculation requires an EPD link.
Revit 2025 plugin
ISO 19650 metadata
↓ IFC 4.3 · BCF · Excel
05 · ESG
STRATOXEnvironmental report
What is the building's carbon footprint — and how do you prove it to the authority or the bank? STRATOX solves these two questions. It calculates how much carbon dioxide burdens construction and operation, then at the press of a button fills in the mandatory reports (EU Taxonomy, CSRD) — the paperwork you'd normally pay an expert for weeks.
1,051
tonnes CO₂ equivalent · A1–A3 phase · GWP100
370 kg CO₂eq/m²
15% below the industry reference value
5/6 DNSH criteria met · 1 measure required
AA+ energy rating · 42 kWh/m²/yr
NZEB ✓
↓ Taxonomy PDF · ESRS E1 XML · GRI 305
Further application areas
ELOP
LIVE APPLICATION · elop.hu
ELOP · the factual benchmark · key application area
The construction industry's
digital memory
What does a school renovation really cost? The answer doesn't come from estimates, but from projects already built. That is why ELOP gathers the actual costs, settlements and technical outcomes of completed investments — and makes them searchable for everyone working on the next one.
Its task is to process, structure and analyse the data of closed projects, so that the experience of every investment becomes the knowledge base for the ones that follow. From earlier projects the system builds a benchmarkable, comparable, AI-analysable knowledge asset that supports cost estimation, project review, decision-making and investment preparation.
ELOP can serve as a national reference system for reviewing investments and checking their realism. Based on the actual technical, cost, resource and performance data of previously completed projects, it enables objective analysis and comparison of investments.
Reality checking is ELOP's job: the system automatically measures planned projects, incoming bids and — emphatically — the settlements of completed investments too against the actual data, and flags anything that doesn't add up. A closed project is not exempt from scrutiny either: costs deviating from market references, unusual technical solutions, resource-use anomalies and unjustifiably high or low prices are flagged the moment the data arrives. In this way ELOP supports oversight, decision-making, cost estimation and investment transparency.
ELOP contributes to a more transparent construction and public-procurement environment built on objective data and supporting genuine market competition.
Every completed investment grows STRATERA's collective knowledge asset.
STRAVISION
ALREADY LIVE · stravision.hu · MULTIPLE LOCATIONS
STRAVISION · the survey · key application area
Digital mapping
of the building stock
What if, by entering a few street names, you could see all the buildings of a district in 3D within minutes — together with their energy condition? That is exactly what STRAVISION does: from open geospatial data it automatically surveys the building stock of the selected area. The first pilot area — Budapest XV, the zone bounded by Telek utca, Rákosmező utca, Fazekas sor and Aporháza utca — produced its 845 buildings in minutes at the press of a button; further locations have since followed, and the stock keeps growing.
For every building the system produces an energy estimate — good / medium / poor class, annual energy consumption, CO₂ emissions and renovation resource need — and gives an aggregated energy picture of the area. IFC models processed in STRABIM can be fitted as archetypes to the real stock: the renovation of similar buildings can be calculated with the model's itemised, priced data.
Area selection is self-service: it's enough to give the bounding streets, and the import, energy classification and model fitting run automatically. The results are estimates of a unified methodology — not energy certificates — but they are produced in large volume and instantly, so the stock-level picture emerges in minutes rather than days.
STRAVISION thus supports municipalities, state institutions, utilities and investors in the strategic planning of the building stock, the preparation of energy-modernisation programmes and the delivery of decarbonisation goals.
NEW DEVELOPMENT · COMMUNITY OFFICE REPORT
What if a community office opened on this street?
STRAVISION's stock analysis answers a new question too: for the surveyed district it models what would happen if residents worked in a nearby community office during the day and could turn the heating down at home. Every layer is computed from the existing energy estimates, with no external data — the population from the heated floor area, an 800-metre catchment, and office candidates automatically selected from the public-purpose buildings.
Shared workspaces
A meeting point of mixed professions in the district — a space for serendipitous collaboration, instead of isolation at home.
Replacing the commute
Working locally radically cuts the kilometres travelled — less cost and less CO₂.
Energy savings
Daytime heating turned down at home versus the office's consumption, in a single kWh balance from building-level estimates.
Per-candidate case calculation: from the district's residents, the expected number of members → office size → investment, energy balance, commute replacement and community-level return. On the map a gold dashed outline marks the candidates, with a case card on click. The kWh balance is authoritative; the monetised saving is indicative.
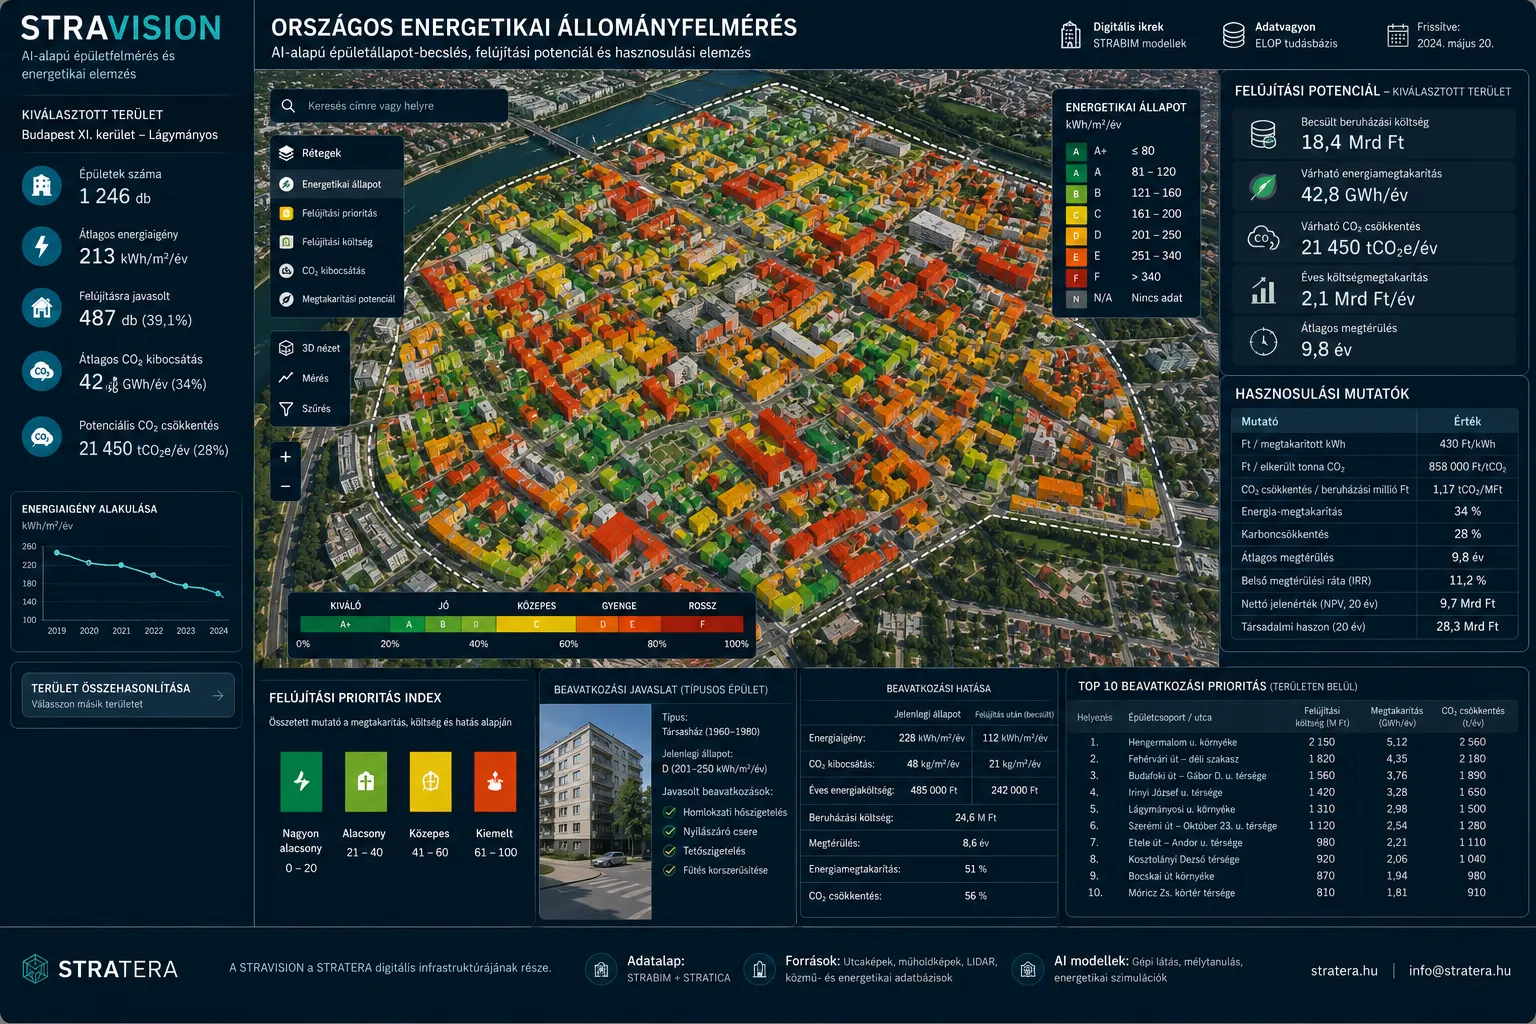
The maps, indicators, costs, savings and other results shown are illustrative sample data. The aim is to demonstrate the national energy and renovation analyses STRAVISION can produce, not the actual assessment of a specific area.
The goal is to create a national digital building stock that can be continuously updated, analysed and connected with the other elements of the STRATERA ecosystem.
Open STRAVISION →
Already live, with several surveyed locations — 3D map, energy classification, archetype fitting; the latest stock figures are shown on the site.
STRAFACIL
STRAFACIL · operations · key application area
Handover is not the end —
the switch to operations
The longest — and overall most expensive — phase of a building's life is not construction but operation. STRAFACIL brings here all the knowledge accumulated during construction: after handover, every room, system and piece of equipment starts with the data of the products actually installed, not a blank page.
Onboarding is two-way: if an IFC model exists, the BIM base data comes from it; if not, the building or building complex can be recorded with STRATICA's coding system too — fully valid even without a model. On this backbone the daily processes are built: planned maintenance with the mandatory inspection cycles, mobile fault reporting and work-order handling, warranty tracking from installation data, and monitoring of document expiries.
Energy monitoring closes the loop: the actual consumption of manually recorded or API-connected meters can be compared with STRAVISION's and STRATOX's estimates — so the platform's estimation models are refined from real operational data.
The first target group is institutional operators: schools, offices, healthcare and other public institutions, where statutory inspection obligations, documentation and plannable renovation are everyday tasks. Renovation preparation is supported by COSTRATA's benchmarks and STRAVISION's stock analysis.
A building's knowledge is not lost after handover — it becomes the tool of everyday operation.